Home / Platforms / Production Reporting

Production Reporting &
SQL Data Warehouse

Most operations do not have a reporting problem. They have four reports that disagree, a shift boundary defined differently in each one, and someone rebuilding the same spreadsheet every morning at five. This puts the definitions in one governed place and makes every dashboard, report, and workbook read from it.

One place where the definitions live.

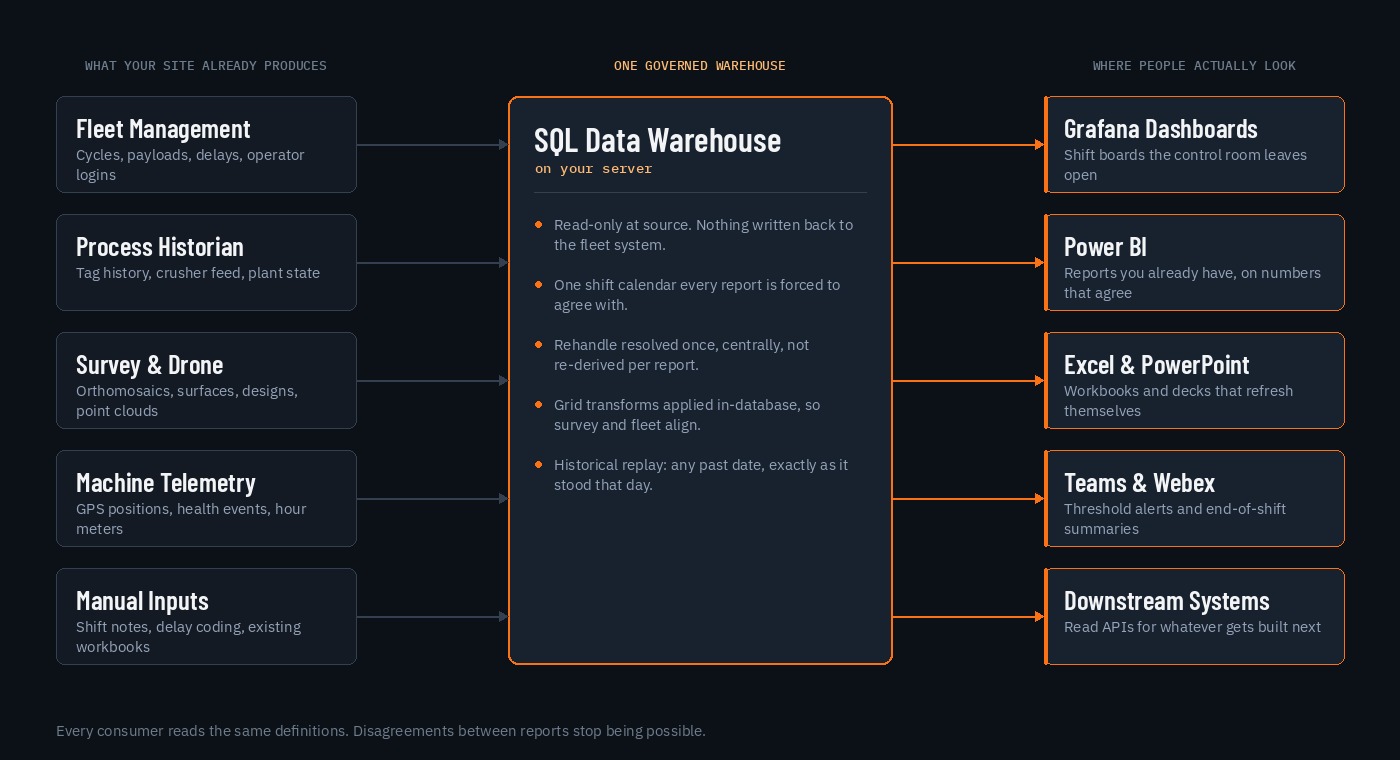
Nothing is ripped out and replaced. The fleet system, the historian, and the survey pipeline stay exactly where they are and are read from, never written to. Power BI stays if you like Power BI. What changes is that the arithmetic stops happening in five places at once, and that the plumbing underneath it is not metered per run.

Data flow: fleet management, process historian, survey and drone, machine telemetry, and manual inputs feeding a governed SQL warehouse on site, which in turn feeds Grafana dashboards, Power BI, Excel and PowerPoint, Teams and Webex alerts, and downstream read APIs
Agreement

One Shift Calendar, Enforced

Shift boundaries, crew rotations, and day versus night are defined once and applied everywhere. Two reports covering the same shift cannot return different tonnes, because they are no longer allowed to disagree about when the shift was.

Rehandle

Rehandle Resolved Centrally

Rehandle is where mine reporting quietly double counts, and every report tends to solve it differently. Here it is resolved once, in one measure family, with the stockpile and pad variants your operation actually runs. Every consumer inherits the same answer.

Coordinates

Grids Reconciled In The Database

Mine grid, UTM, and whatever conventions have accumulated over the pit's life, transformed in-database against a surveyed control network. Fleet positions, dump records, and survey products land on the same map without anyone converting anything by hand.

Replay

Any Past Date, As It Stood

Reports run against a date anchor rather than only against now, so you can reproduce last Tuesday's night shift exactly as it appeared at the time. Reconciliation arguments, incident reviews, and month-end queries stop depending on whether anyone took a screenshot.

Resilience

A Second Path To The Numbers

Cloud reporting reaches your data through one on-premises gateway on one scheduled refresh, and both fail from time to time, always on the morning somebody needs the number. A second path reading the same warehouse directly means the shift board is still on the wall when the refresh did not run. Not a replacement for what you have, a floor underneath it.

Fairness

Comparisons Normalized By Route

Comparing crews or loading tools on raw tonnes rewards whoever drew the short haul that month. Cycle performance is normalized route by route and pooled only within the same shift type, and the number of routes actually compared is stated on the face of the report so you can see the basis rather than trust it.

Time usage

The Full Hours Ladder

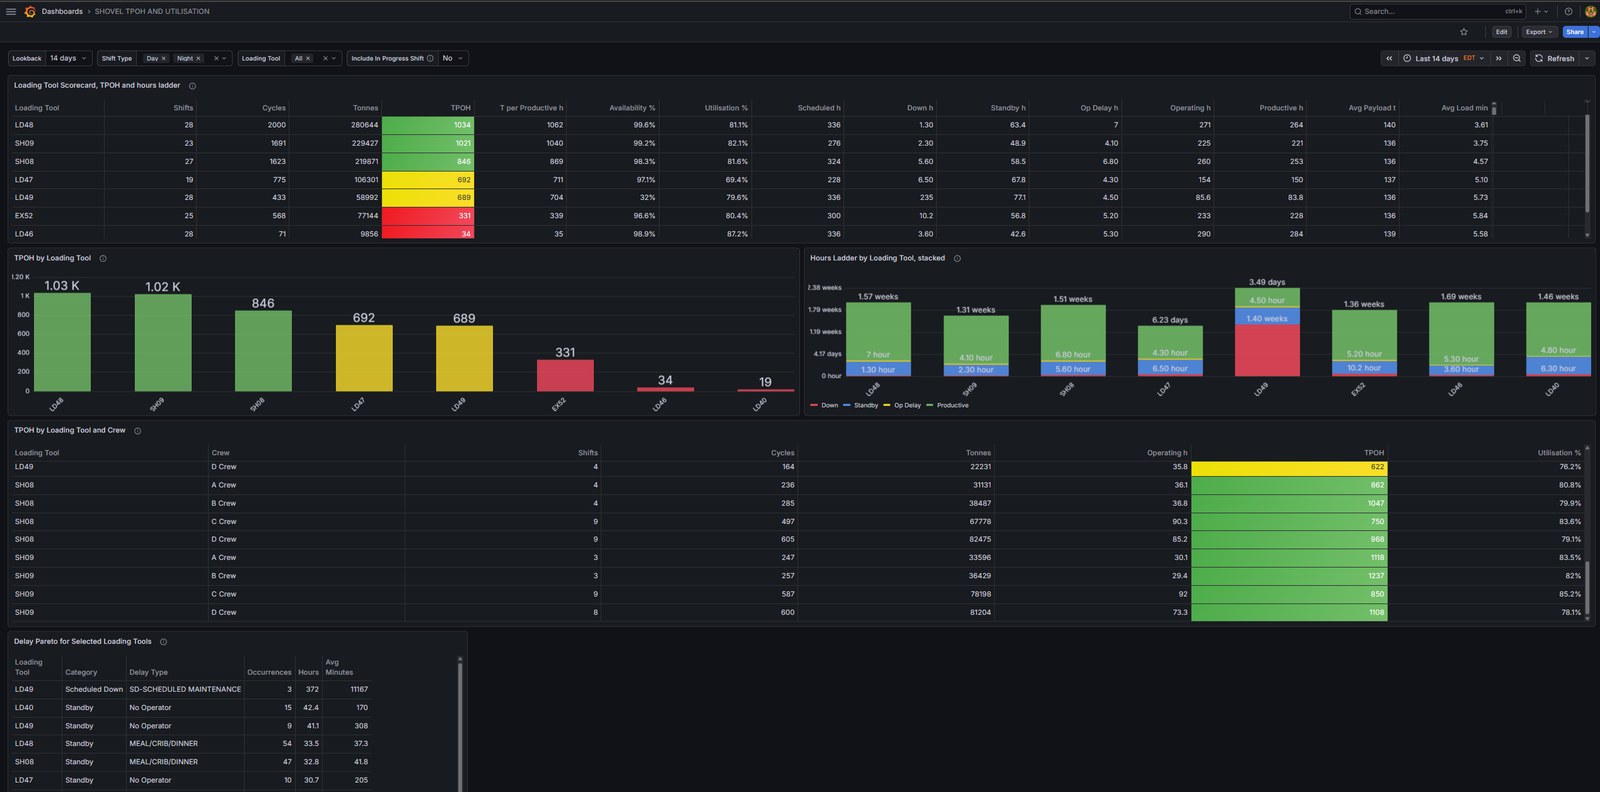
Scheduled hours accounted all the way down through down, standby, and operating delay to productive hours, per machine, with availability and utilization falling out of the same arithmetic. Then a delay Pareto that names the categories, so the hours have somewhere to point.

Cost

No Seats, No Capacity, No Meter

Open-source dashboarding alongside whatever you already own, unlimited internal users, and no per-run billing on the pipelines underneath. Whether a supervisor gets to see the shift board stops being a licensing decision made in a different building.

Boards the control room leaves open all shift.

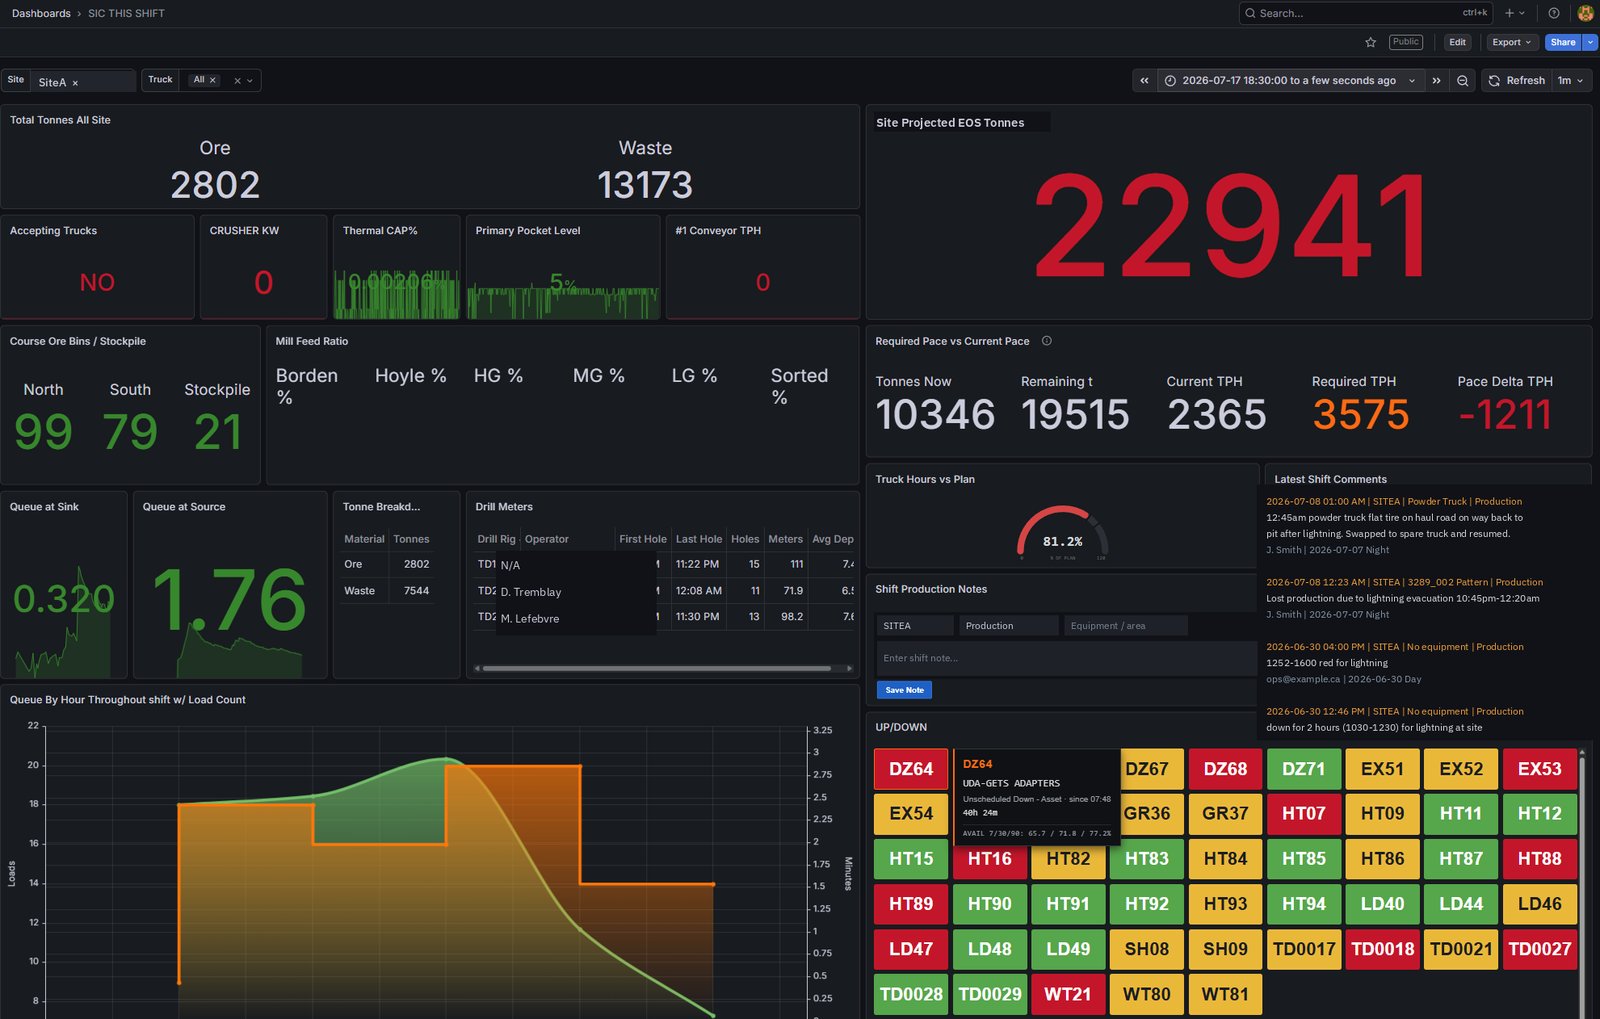
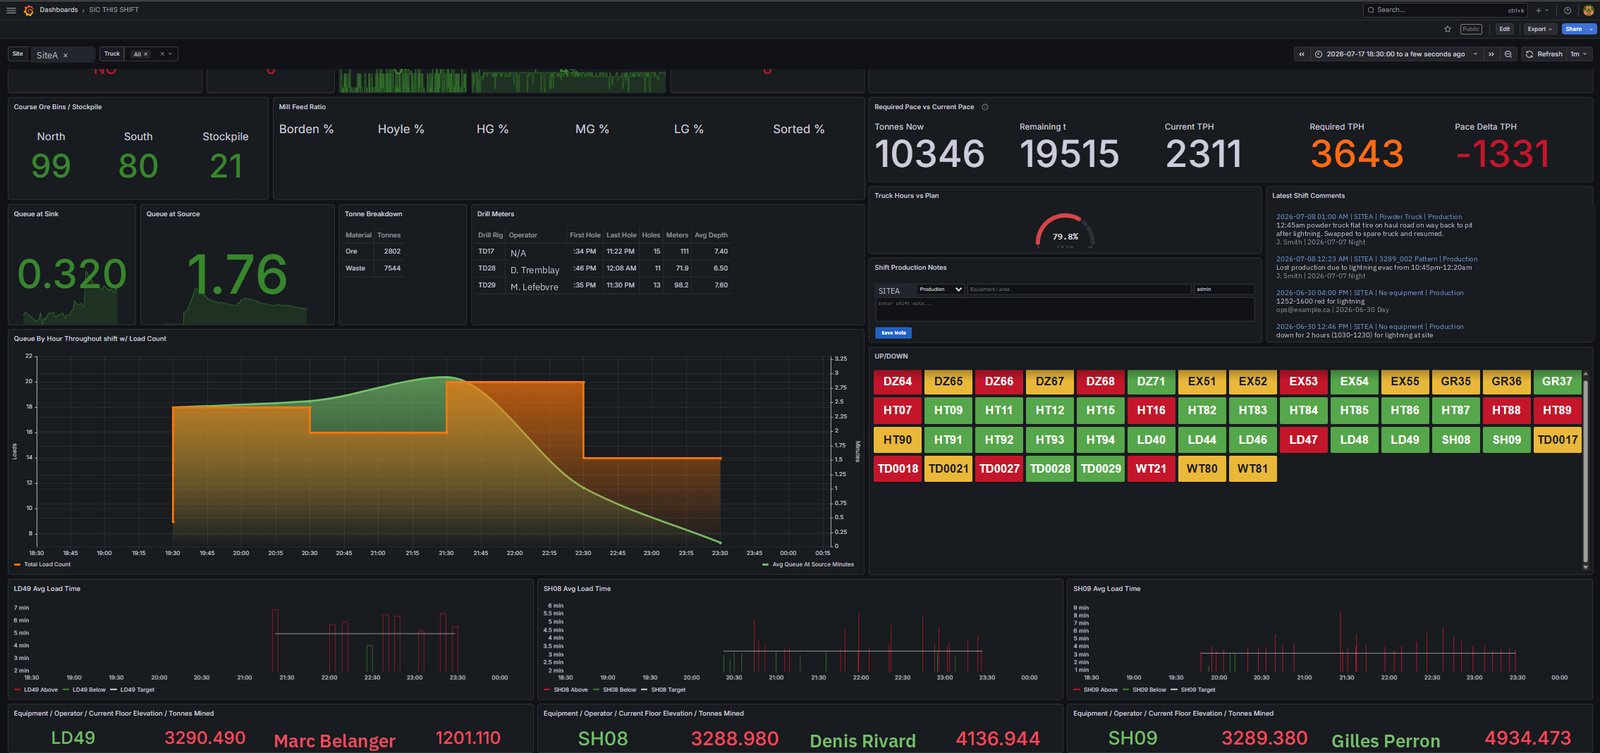
Pace against plan, projected end of shift, queue at source and sink, loading tool performance, delay breakdowns, drill metres, mill feed ratio, and an equipment up and down board, on data that updates while the shift is still running.

Shift production dashboard: tonnes against plan, projected end of shift, queue analysis, and per-operator production
Full shift board: pace versus plan, queue analysis, loading tool performance, fleet up and down status, and per-operator production

Screenshots from production systems. Site and personnel identifiers have been altered.

Comparisons that survive being questioned.

The live boards answer what is happening. These answer whether it is any good, which is a harder question because the first thing anyone does with a comparison is look for the reason it is unfair to them. Both of these are built to lose that argument gracefully.

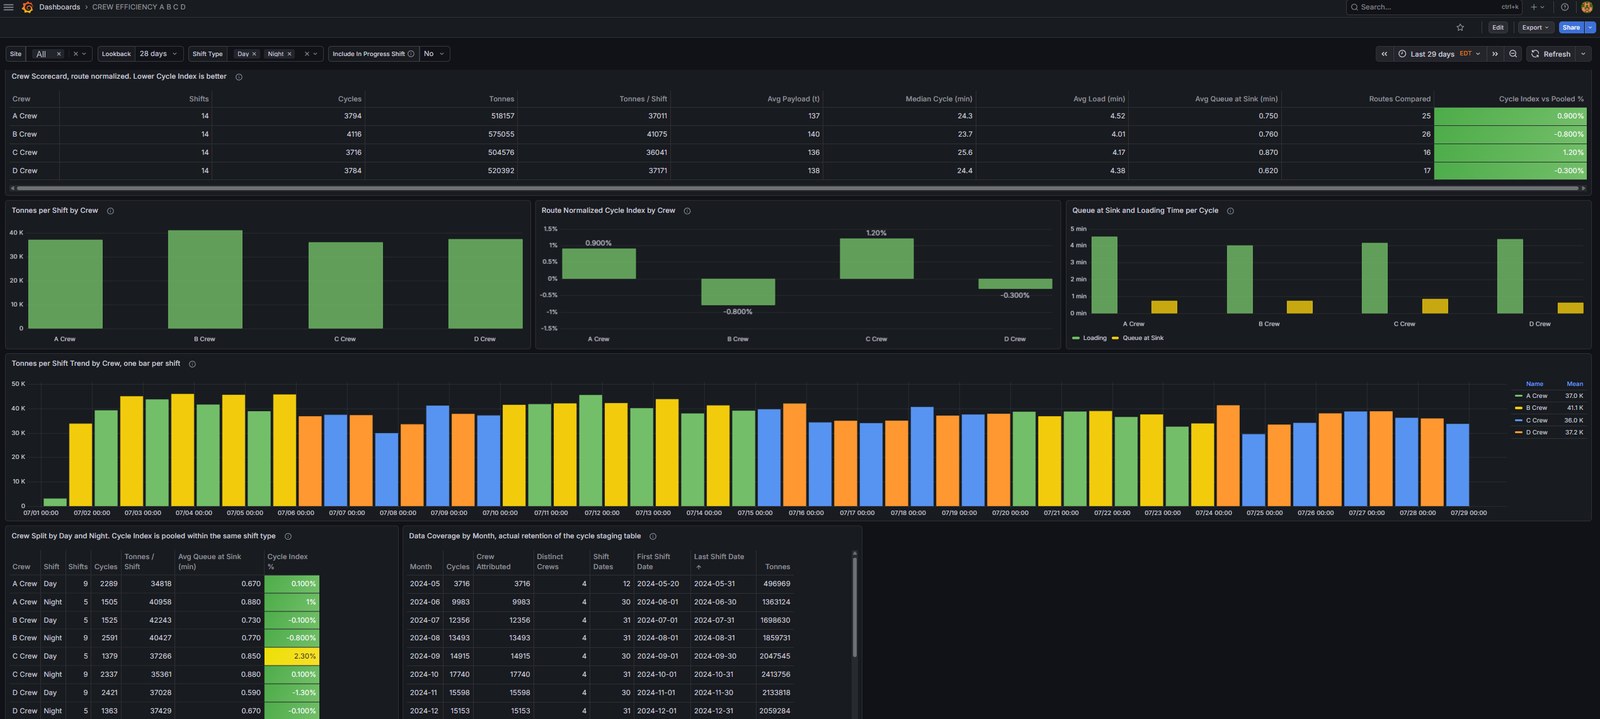
Crew efficiency dashboard: route-normalized cycle index per crew with shifts, cycles, tonnes per shift, median cycle, average load and queue times, the count of routes compared, a per-shift trend, a day and night split, and a data retention panel
Loading tool dashboard: tonnes per operating hour scorecard with availability and utilization, a stacked hours ladder from scheduled through down, standby and operating delay to productive hours, tonnes per operating hour split by crew, and a delay Pareto naming categories such as no operator and meal breaks

What the crew board is really for: over that window every crew sits within about one percent of the pooled average on route-normalized cycle index, and the spread from best to worst is two percentage points. That is the useful answer. It says the variance worth chasing is not in the crews, and it stops a conversation that would otherwise have run on anecdote for another year. A comparison that can only ever produce a culprit is not measurement, it is a weapon, and it gets treated as one.

What the loading tool board is really for: the delay Pareto is where the hours go from being an accounting exercise to being a decision. Standby hours attributed to no operator, sitting alongside meal and crib standby, are two very different problems with two very different fixes, and neither is visible in an availability percentage.

Screenshots from production systems. Site and personnel identifiers have been altered.

Start with a sprint or build the warehouse.

The full platform is not the only way in. If your data is already reachable and the problem is that nobody can see it, a dashboard sprint gets something useful in front of the crew in a fortnight and pays for itself in arguments avoided.

Dashboard Sprint

Two to three weeks, built directly on the data you already have, with no warehouse work. Production against plan, payload and cycle analysis, utilization, delay breakdowns, crusher feed, and the specific KPI somebody asks for in every meeting. Honest about its limits: if the underlying definitions disagree, a dashboard will render that disagreement faster and in colour.

2 to 3 weeks · fastest path to something visible

Warehouse Build

Four to eight weeks. Source connections, the shift calendar, rehandle logic, coordinate transforms, historical replay, and the dashboards on top. This is the one that makes the disagreements stop rather than displaying them more clearly.

4 to 8 weeks · the definitions get fixed

Assessment First

If you are not sure which of those you need, that is exactly what the assessment answers, and 25 percent of the fee is credited against whichever you engage.

1 to 3 weeks
How assessments work →

What this replaces.

The Five A.M. Spreadsheet

Somebody at your operation assembles the same workbook every morning from three exports and a copy-paste. It takes an hour, it is the highest-value hour of an experienced person's day, and it introduces an error roughly as often as any manual process does.

An hour a day, back

Meetings About Whose Number Is Right

Two departments arrive with different tonnes for the same shift and the first twenty minutes goes on reconciling them instead of deciding anything. That meeting has a cost and everyone has stopped noticing it.

One number, arguable on merit

Per-Seat Analytics Licensing

Reporting seats priced per person, which turns visibility into a budget line and quietly decides that supervisors do not need to see the data. Unlimited internal users on your own server removes the question.

Visibility stops being rationed

The Premium Connector Tax On Your Own Data

Cloud automation platforms bundle a free tier that covers mail, chat, and spreadsheets, and classify the site database as premium. At a mine every automation worth building reads that database, so there is no free tier in practice. One premium connector makes the whole flow premium, and from there you are choosing between per-user licences, roughly a hundred and fifty US dollars per month for each flow, or metered billing near sixty cents per run. A service that checks something every fifteen minutes runs ninety-six times a day. Do that arithmetic across a year and across the handful of checks an operation actually wants, and the licensing costs several times what the automation was worth.

A Python service on your server has no meter

Automation Projects That Stall On Procurement

The more common outcome is not a large bill, it is a useful piece of work sitting finished and undeployed while a licence request moves through approval. Nothing on your own infrastructure needs a purchase order to start running.

Built Friday, running Monday

On your infrastructure, reading your systems.

Which report do you not trust?

That question usually locates the problem faster than an architecture discussion. Tell us what you run and which number gets argued about, and the shape of the work is normally obvious within a call.