Your systems already know when a shovel has been down for forty minutes, when the crusher
stopped taking feed, and when a crib break ran twenty minutes long. The information exists
and nobody is looking at it, because looking at it is somebody's tenth priority. This
watches instead, and puts one message where the people who can act on it already are.
Every operation has already muted an alerting system.
Detection is the easy half. The half that decides whether this is worth anything is
whether the channel still gets read in six months, and that is a design problem, not a
configuration one. Everything below exists because of it.
Transitions
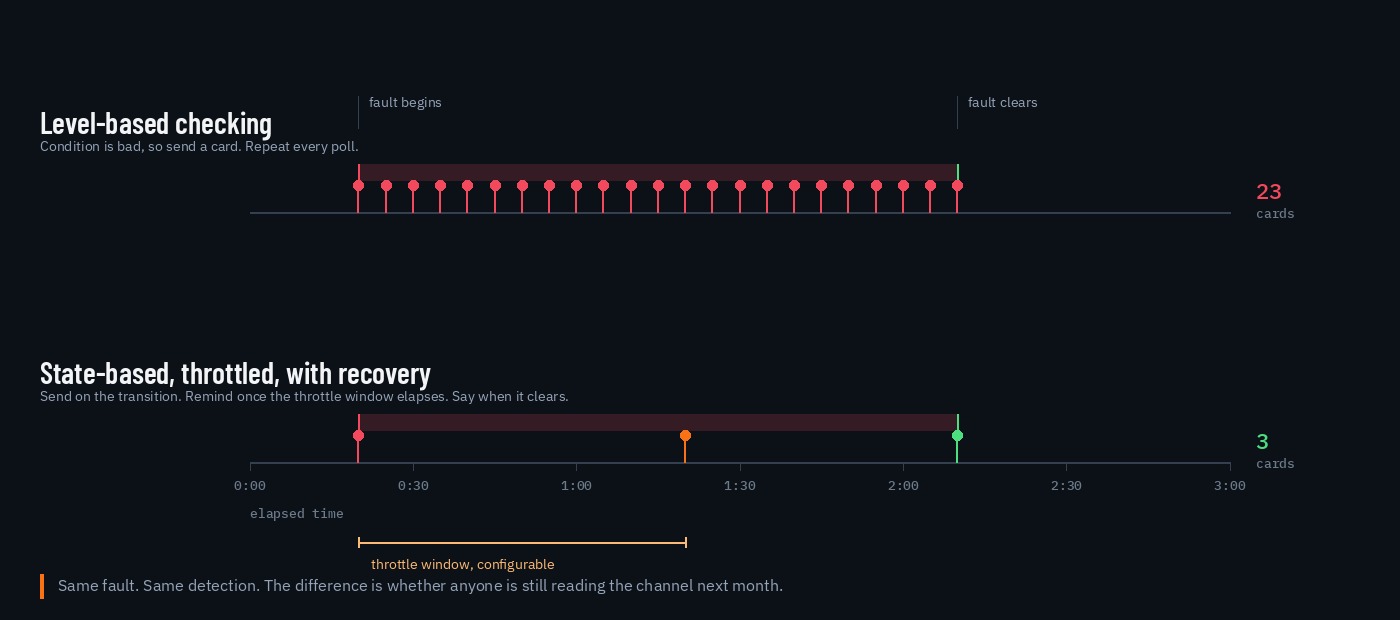
Alerts On Change, Not On State
A condition that has been bad for six hours is not six hours of messages. The alert
fires when something crosses a line, and then the channel is quiet until something else
changes. This single decision is the difference between a tool and a nuisance.
Throttle
One Reminder, Not A Stream
Faults that persist deserve a nudge, not a drip. A configurable window sets how long
before a still-broken check speaks again, counted from the original alert rather than
reset on every poll, which is the bug that turns hourly reminders into constant ones.
Recovery
It Tells You When It Is Over
A channel that only ever reports failure teaches people that opening it is bad news
and they stop. Recoveries are announced, so the channel carries a complete story and
reading it is sometimes reassuring.
Honesty
Cannot Tell Is Not The Same As Broken
When a check cannot reach what it monitors, it reports unknown rather than critical.
Things that are legitimately absent are marked expected and stay grey. A monitor that
cries failure whenever it cannot see is a monitor that gets ignored when it is right.
Dedup
Keyed To The Thing, Not The Poll
Findings are keyed on the business object, a haul cycle, a shift, a machine, so the
same event cannot be reported twice no matter how often the service runs or how it is
restarted mid-shift.
Reach
No New Application To Adopt
Messages land in a Microsoft Teams or Cisco Webex channel that you populate: dispatch,
maintenance planning, the pit supervisor, the superintendent. No app to install, no seat
to license, and nothing anyone has to remember to open.
What gets watched
Whatever your shift actually argues about.
These are the ones already running. The list is not a menu so much as an illustration:
anything your systems record and nobody watches is a candidate.
Delay And Downtime Thresholds
A machine down longer than the threshold you set, with the delay code, the duration,
and who is on it. The point is not the record, it is that somebody hears about it at
forty minutes rather than reading about it at end of shift.
While it is still actionable
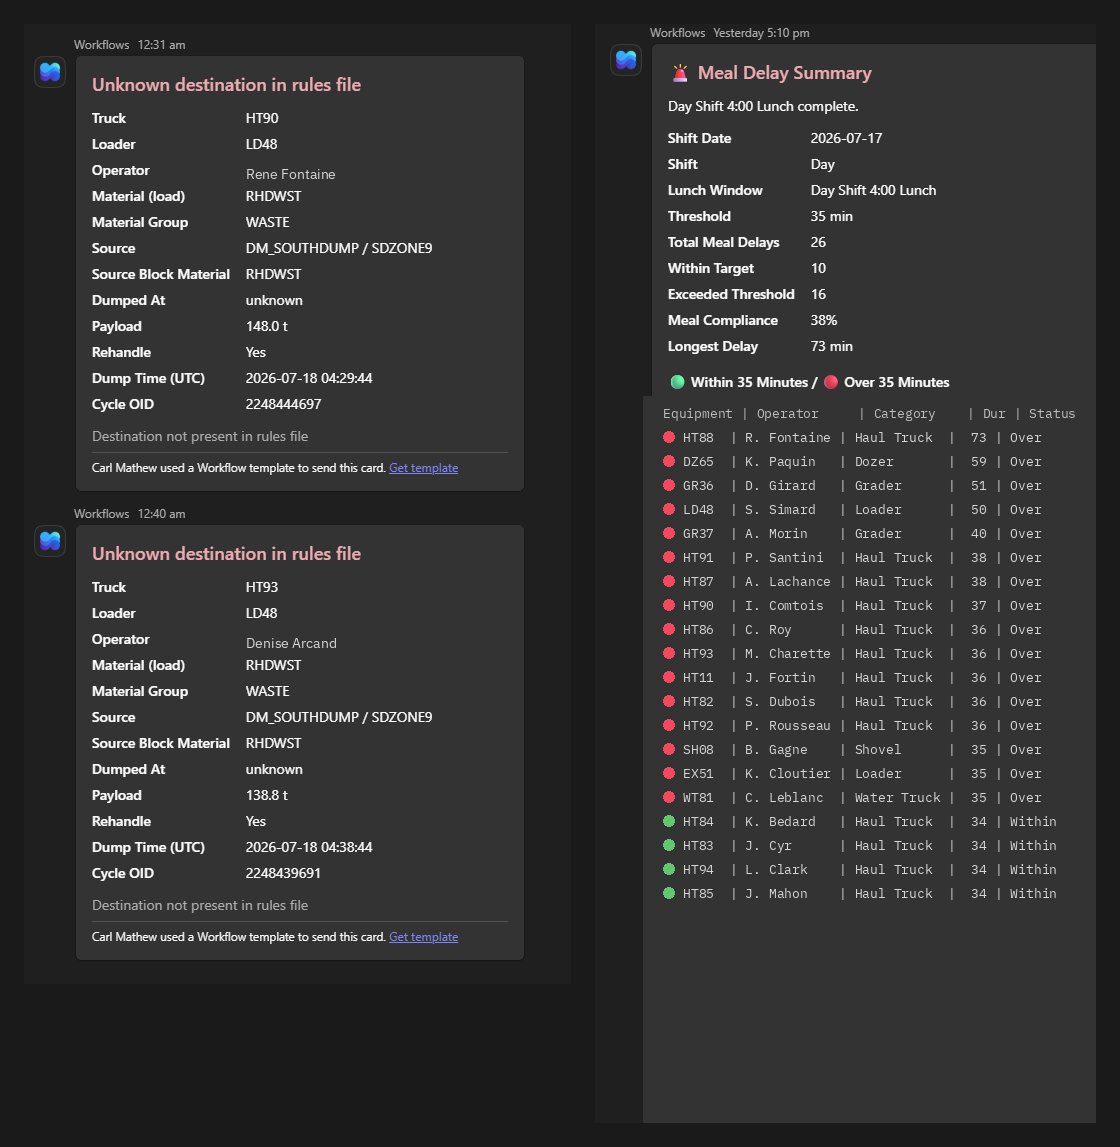
Meal And Crib Window Compliance
Real-time alerting when a break window runs past its threshold, and an end-of-window
summary for supervision. Worth noting what this is for: the loading tool delay Pareto at
most operations has meal and crib standby near the top, and it is one of the few
categories a supervisor can influence during the shift rather than after it.
Live threshold plus a shift summary
Crusher Feed Interruptions
Feed stopping when it should not be, surfaced immediately rather than discovered in
the morning reconciliation of why the mill was short.
Minutes, not the next morning
Pace Against Plan
Projected end of shift falling below plan by a margin you set, early enough that
moving a truck or opening a second face is still a decision rather than a post mortem.
Intervene, not report
Material Misroutes
Wrong-destination dumps caught against the block model and the destination
configuration, with four independent detection layers.
The end-of-shift summary, the daily pack, and the workbook somebody currently
assembles by hand, generated and delivered on a schedule with nobody in the loop.
The five a.m. spreadsheet, retired
Beyond thresholds
Some problems have no number to set.
Everything above fires when something crosses a line somebody chose. That covers a great
deal, and it cannot cover drift: a haul route that has quietly become five percent slower
has no threshold, because nobody knows what that route's normal is and its normal changes
every time the pit does. The Operations Advisor works the other way round. It learns what
normal was, per route, per machine, per face, and reports the departures with the effect
size, the sample it is standing on, and a confidence figure.
It is built on the same delivery layer as everything on this page, so the findings arrive
in the same channel, graded so they can be triaged by scrolling. It is scoped as its own
engagement because it needs something the others do not: a period of accumulated history
at your site before it is entitled to an opinion.
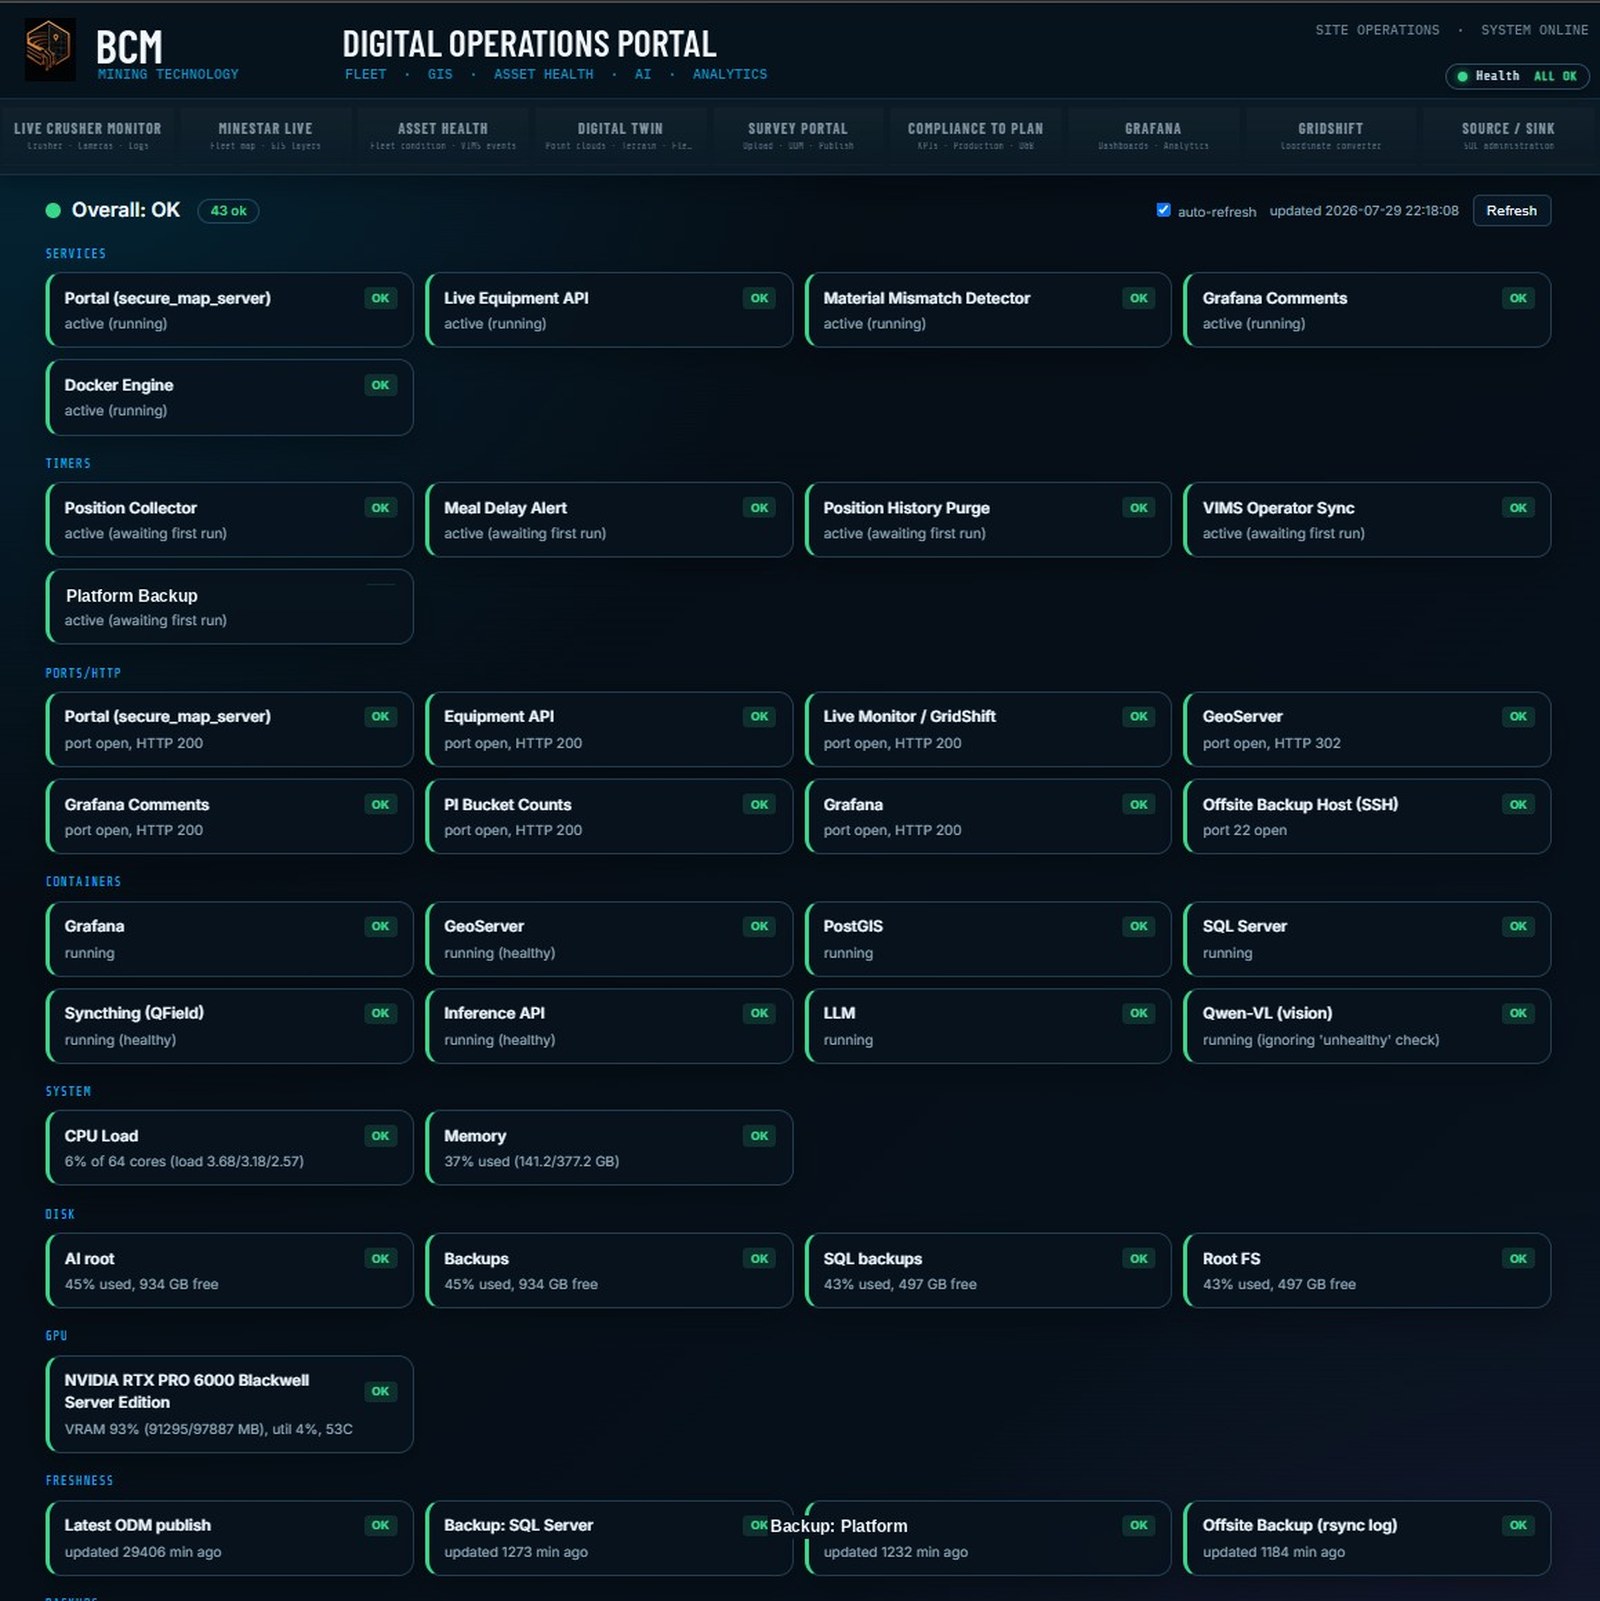
An alerting service that dies quietly is worse than no alerting service, because the
silence reads as good news. So the stack monitors itself on one page: services, scheduled
jobs, ports and HTTP responses, containers, CPU and memory, disk headroom, GPU load, and
the freshness of every dataset the reports depend on. Forty-three checks on the portal
below, each one clickable through to what it means, how to restart it, and what to look at
if restarting does not fix it.
That last part is the difference between documentation and a runbook. The guidance lives on
the check itself, so the person looking at a red card at two in the morning is one click
from the fix rather than searching a shared drive for a procedure written by somebody who
has since left.
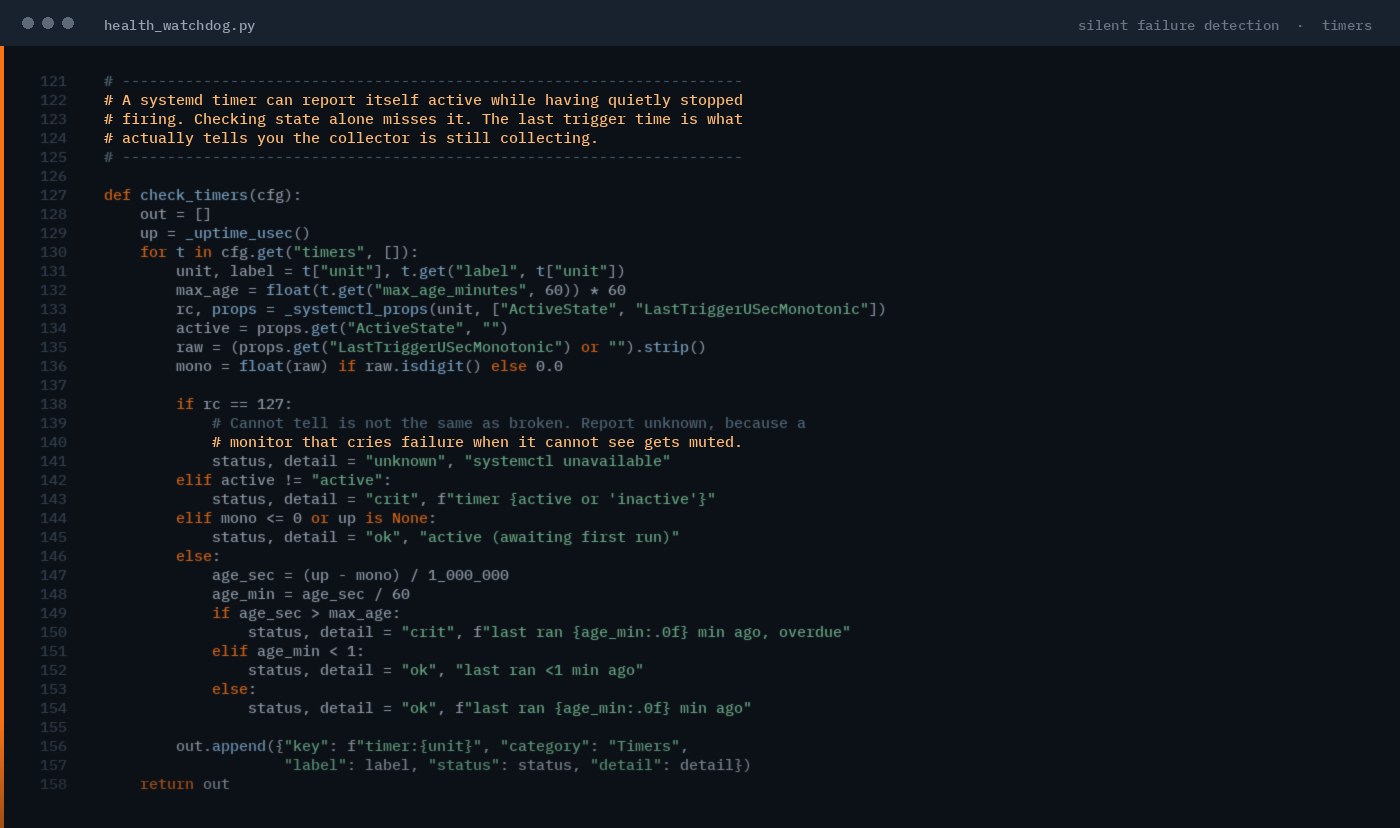
The failure mode that excerpt exists for: a scheduled job can report
itself perfectly healthy while having quietly stopped running. Checking whether it is
enabled tells you nothing. Comparing its last run against a maximum age is what catches a
collector that stopped feeding your reports three days ago, which is the kind of thing
normally discovered by someone asking why a number looks wrong.
Screenshots from production systems. Site and personnel identifiers have been altered. Line numbers are genuine; schema identifiers elsewhere on this site are masked.
Why it pays
What this replaces.
Finding Out At Handover
Most operational problems are already recorded somewhere by the time anyone acts on
them. The cost is not the missing data, it is the hours between the event and somebody
noticing, and those hours are where production goes.
Same event, hours earlier
The Premium Connector Tax
Cloud automation platforms bundle a free tier for mail and spreadsheets and classify
your site database as premium, so every automation worth building falls outside it. From
there it is per-user licences, per-flow subscriptions, or metered per-run billing, and a
check that runs every fifteen minutes runs ninety-six times a day. A Python service
under systemd on your own server has no meter on it at all.
No licence, no capacity tier, no per-run charge
Automation That Waits On Approval
The more common cost is not a bill, it is finished work sitting undeployed while a
licence request moves through procurement. Nothing on your own infrastructure needs a
purchase order before it can start running.
Built Friday, running Monday
Delivery
Two to three weeks per alert family.
Typical build2 to 3 weeks for the first alert family including threshold
tuning against history, and less for each one after, since the delivery and throttling
layer is already in place.
Tuning firstEvery threshold is replayed against your own history before
anything is switched on, so day one is not a hundred cards. Getting this wrong once is
usually fatal to adoption.
Reads fromYour fleet management system, historian, and site databases,
read-only. Nothing is written back.
Runs onSmall Python services under systemd on existing site hardware,
with configuration that reloads in place so a threshold change needs no redeploy.
DeliveryTeams or Webex incoming webhook, or email. Webex is the simpler
of the two to stand up if your site is on it.
CredentialsLoaded from environment files, never held in code or in
anything committed to a repository.
Self-monitoringThe health portal ships with the first alerting
engagement rather than being sold separately, because an alerting stack nobody can see the
state of is not finished.
Advisory layerThe Operations Advisor is scoped separately, because it
cannot report anything until it has accumulated enough of your history to know what your
normal is.
Pairs withThe SQL warehouse, where alerting stops being a stream of
individual events and becomes a trend you can argue from, and where the advisory layer
gets the history it needs.
Next step
What did you find out too late this month?
That question is usually the whole scoping conversation. Tell us the event, and whether your systems already record it decides how quickly it can be watched.
 BCM
BCM