Home / Solutions / Equipment Health
Equipment Health &
VIMS Telemetry
Production deployed
Product maturity · Data and deployment requirements
Your fleet already records everything: every fault, every gear change, every strut
pressure, every second. Most of it dies in files nobody can read. This platform decodes
it, all of it, into a database your operation owns, with dashboards, maps, and a full
time machine for every truck.
Equipment health & safety
Scope the capability before deployment.
Maintenance teams need decoded equipment events with enough context to investigate.
Built and running in mine operations. The implementation examples show the workflow and outputs. The Technology & Data Assessment defines the data connections, configuration and acceptance criteria for your mine. Public demonstrations use synthetic data.
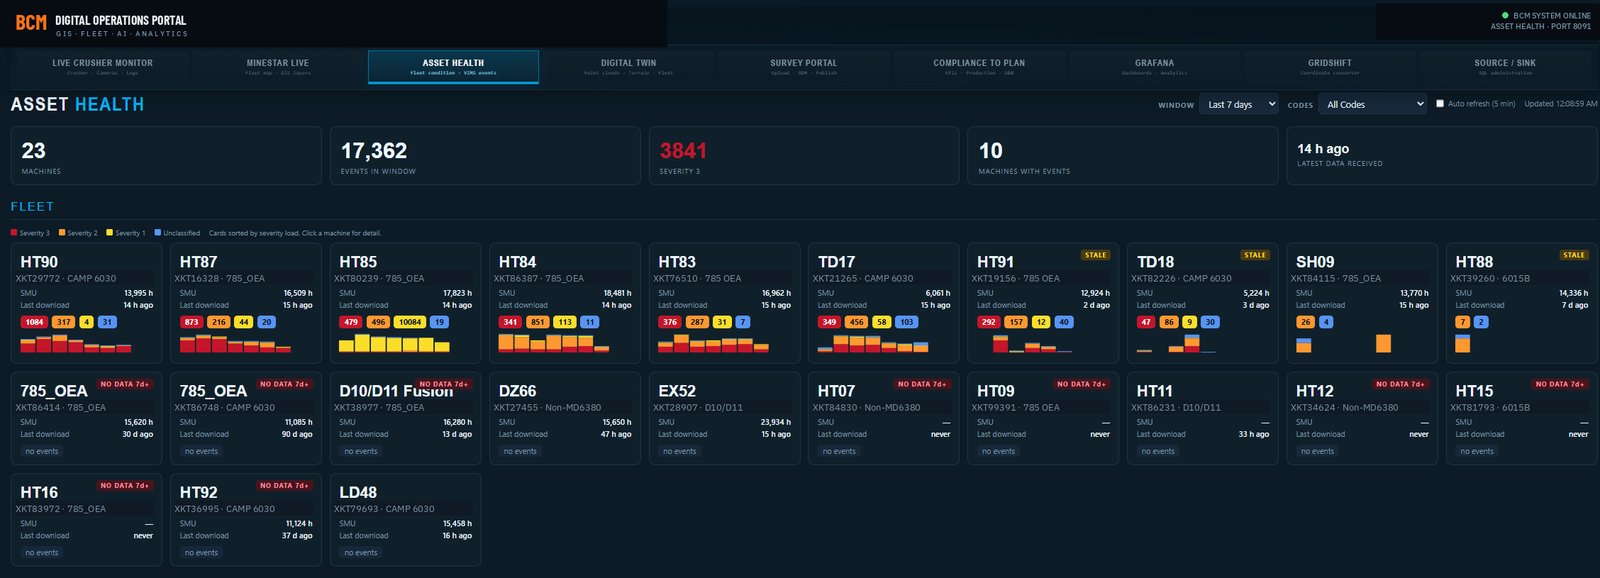
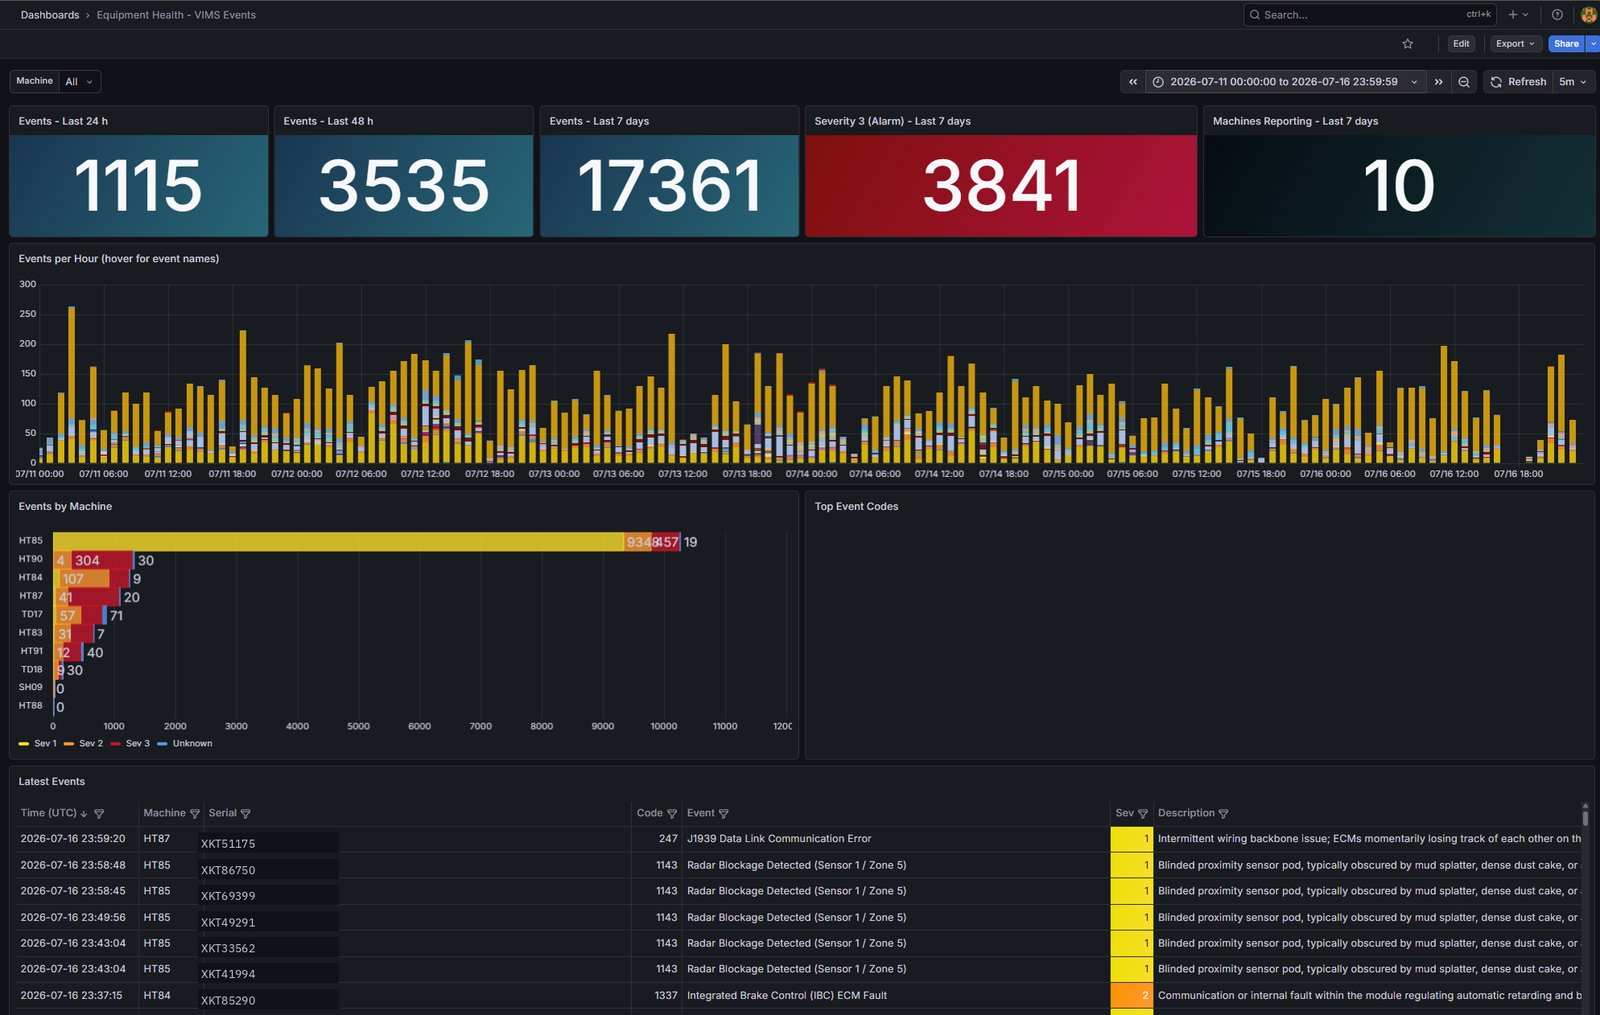
- What it doesVIMS ingestion and decode, equipment events, per-machine dashboards, spatial event views, replay and data-freshness checks; DSS device-health monitoring and mapped safety-event hotspots; Bridgestone TPMS monitoring in Grafana.
- Data requiredAuthorized OEM telemetry files, DSS device-health and safety-event feeds, Bridgestone TPMS data, machine identifiers, event locations, timestamps and approved operator associations.
- PrerequisitesAuthorized telemetry interfaces, format/version samples, decoder validation, device and machine mapping, event coordinates and an agreed retention policy. VIMS, DSS and Bridgestone TPMS monitoring are production deployed.
- OutputsEvent history, severity summaries, device-health views, mapped safety-event hotspots, Grafana TPMS dashboards, replay and evidence for maintenance and safety investigations.
- ImplementationAccess, integration, cybersecurity and data quality are assessed before duration or acceptance is committed. Existing workflow descriptions are not delivery guarantees.
Demo coverage and limits
Commercial engagement
Software subscriptions provide platform access and include applicable updates, defect fixes and standard product maintenance. Optional Premium Support is $50,000 CAD per mine annually for additional operational assistance under agreed service terms. Custom development, new integrations, custom reporting, specialized analysis and advanced troubleshooting outside support scope are separately billed consulting at $260 CAD/hour, unless expressly included in a signed agreement. All amounts exclude applicable taxes.
Implementation is quoted for deployment requirements. No consulting hours or Premium Support are automatically bundled with software. Estimate software, support and consulting.
Technology & Data Assessment Full pricing and service boundaries →
Related solution modules · Technical case studies · Request an assessment
 BCM